The EPICURE Regression Programs
The EPICURE regression modules are tools for working with
general risk models arising in analyses of epidemiologic or experimental
studies. In this section we describe the types of data, basic assumptions, and,
in general terms, the types of models available in each of the regression
modules.
All of the EPICURE modules have extensive
capabilities for data entry and transformation, variable creation, and subset
selection. In the discussions that follow we sometimes refer to a variable that
is coded in a specific way, for example, 1 for cases and 0 for non-cases.
However, because variables can be transformed or recoded from within any of the
programs at any time, it is not necessary that variables be coded in any
particular way in the input data file.
Summary statistics including sums, means, percentiles, and
frequency tables for categorical variables are easily computed in any of the
programs. These summary statistics may be computed within strata defined by one
or more categorical variables. Simple scatter plots or histograms can be made in
any of the programs. In addition, data and detailed information on the nature of
the fitted models and parameter estimates can be written to files for use by
other programs, such as high-resolution graphics software.
Each EPICURE regression module involves a
statistical model for a quantity that takes on the values  for observations
  . The programs are used to describe the
variation in
. The programs are used to describe the
variation in  as a function of a covariate
vector
as a function of a covariate
vector  , model parameters,
  , and possibly stratum parameters
denoted as
, and possibly stratum parameters
denoted as  . The meaning of
  depends on the statistical model,
but in many cases can be interpreted, in some
sense, as a measure of risk. The following list describes for each of the programs:
depends on the statistical model,
but in many cases can be interpreted, in some
sense, as a measure of risk. The following list describes for each of the programs:
GMBO/PECAN – probabilities, odds or
functions of the odds for binomial data and odds ratios for case-control
data
PEANUTS
- the relative risk or hazard ratio modifying a nonparametric
underlying hazard function for censored survival data
AMFIT - the Poisson mean or a piecewise
constant hazard function for rates (grouped survival data)
The most commonly used risk regression models take the form

Such models are easily fit in the EPICURE programs, but these programs also
make available several more general classes of models. These generalizations
various extensions of the standard model such as
highly stratified models without the explicit use of stratum
indicator variables
models in which the components of  are modeled as a product of
linear and log-linear subterms
are modeled as a product of
linear and log-linear subterms
models that include additive and multiplicative joint effects
of different risk factors
The first of these extensions makes it possible to fit models
with large numbers of stratum parameters because these parameters are estimated
using special algorithms that do not require the inversion of large
matrices.
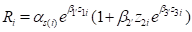
A specific example of the type of models allowed by the second
extension is
The third extension refers to the fact that EPICURE can be used to
fit general relative risk models 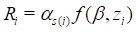 in which the
  are parameters or, in the case of
PEANUTS, functions
associated with user-specified strata and
are parameters or, in the case of
PEANUTS, functions
associated with user-specified strata and takes on various forms
including
takes on various forms
including
 additive excess relative risk
 multiplicative excess relative risk
 additive relative risk,
where each of the terms  is a product of linear and
loglinear parts (subterms). The
is a product of linear and
loglinear parts (subterms). The  are parameters or, in the case of
PEANUTS, functions
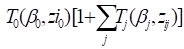
associated with user-specified strata. For binomial and count/rate table
data, it is also possible to fit unstratified additive absolute risk models of
the form
are parameters or, in the case of
PEANUTS, functions
associated with user-specified strata. For binomial and count/rate table
data, it is also possible to fit unstratified additive absolute risk models of
the form

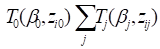
Covariates in the simple standard loglinear relative risk
model, 
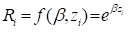 can be specified as
arguments to the FIT command. To specify more general
models, you simply designate the term number and subterm type and list the
covariates to be included in the subterm. Stratification is specified by
providing a list of factors to be used for stratification.
can be specified as
arguments to the FIT command. To specify more general
models, you simply designate the term number and subterm type and list the
covariates to be included in the subterm. Stratification is specified by
providing a list of factors to be used for stratification.
As discussed below, the EPICURE regression modules can be used to
model both time-dependent and time-independent risks. Risks may be modeled
directly ( absolute risk model s) or relative to some baseline ( relative risk
model s). The input data may be in the form of records for individuals,
event-count tables, or event-time tables. The following table summarizes the
features of the regression modules with regard to three factors: time-dependence
of the response variable; type of risk function; and form of the input data.
|
|
MODULES |
|
|
|
GMBO/PECAN |
PEANUTS |
AMFIT |
|
Data Types |
Binomial data |
Matched case-control data |
Individual survival time data |
Count or rate data |
|
Input Data |
|
|
|
|
|
Individual records |
× |
× |
× |
|
|
Event-count Table |
× |
|
|
× |
|
Event-time Table |
|
|
|
× |
|
Time-Dependence |
|
|
|
|
|
Yes |
|
|
× |
× |
|
No |
× |
× |
|
|
|
Risk Function |
|
|
|
|
|
Absolute |
× |
|
|
× |
|
Relative |
× |
× |
× |
× |
GMBO/PECAN is used for modeling binomial
probabilities, odds, or odds ratios. The data for the ith
subject consist of a binary outcome variable yi
indicating cases or events and a covariate vector zi.
The covariates may include both continuous and categorical variables. For
matched case-controlstudies, as discussed below, one or more of the covariates
must define the matched (risk) set or stratum to which each person belongs. For
unmatched studies involving binary outcomes the data can also be grouped as
 , where
  is the number of events in
  trials.
The modules in the last two columns are used for modeling
incidence rates or hazard functions for censored survival data. For these
modules the data for the  subject consist of the follow-up
time
subject consist of the follow-up
time  ; a binary indicator of whether or not
the event of interest occurred,
; a binary indicator of whether or not
the event of interest occurred,  ; and a covariate vector,
  . The covariates may include both
continuous and categorical variables, which can be time-dependent. PEANUTS works directly
with the ungrouped survival data, while AMFIT makes use of data that have been
grouped with respect to time. The grouped data have the form
. The covariates may include both
continuous and categorical variables, which can be time-dependent. PEANUTS works directly
with the ungrouped survival data, while AMFIT makes use of data that have been
grouped with respect to time. The grouped data have the form  , where
  is the number of cases and
  is the total time at risk in time
intervals. DATAB can be used to carry out the grouping needed to prepare
data for use in AMFIT. AMFIT can also be used to model
Poisson means for count data.
is the total time at risk in time
intervals. DATAB can be used to carry out the grouping needed to prepare
data for use in AMFIT. AMFIT can also be used to model
Poisson means for count data.